Forecasting solar energy production with Watson
By bogaert| I tried to figure out how much energy will be produced for each hour of the next day. To do so I integrated several aspects, such as Watson IoT, the Weather API, Watson Analytics, and bundled it all together on the Bluemix platform. |
| Collecting the data |
| I described in my previous blog how I connected the grid converters from the solar panels with the Watson IoT platform. The solar production data is stored as JSON objects in a Cloudant database. Although the data is stored in details for every 5 minutes of energy production we will only use the hourly values. |
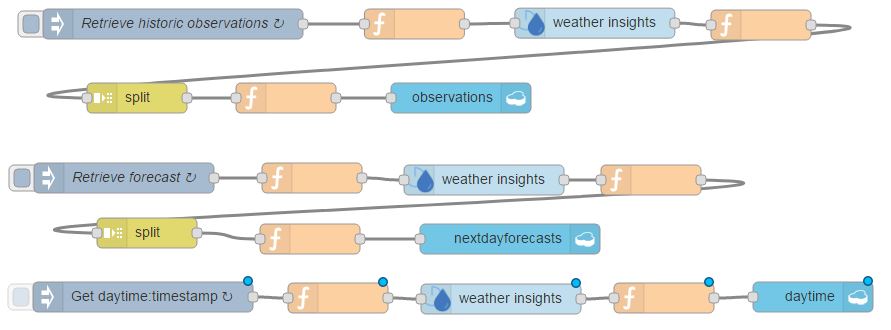
| To obtain the data from the weather company I used NodeRed and some Javascripting. |
 |
| The API is called on a daily basis and gathers the following three types of weather information: - The weather observations at the end of the day for the past 24 hours - The weather forecast at the end of the day for the next 24 hours - Time of sunset / sunrise for the next day All the data is also stored into three Cloudant databases. |
| Preparing the data |
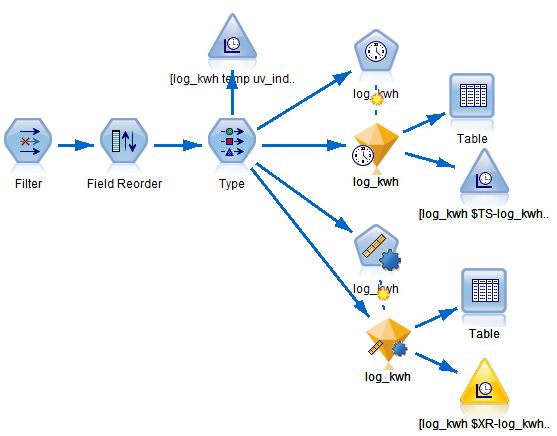
| I used the SPSS modeler to bring the data together. Therefore I installed the Cloudant plugin available on github. Each of the above databases is queried and the data is prepared. |
 |
| I merged the weather observations with the energy production data , thereafter merge with the sunset/sun. This results in a combination of past weather observations, energy production data, and sunset-sunrise values into a single table with all data until the current day. Thereafter I append records for the next 24 hours, but filled with weather forecast data instead of weather observation data. |
| Building a first model |
| I tried multiple models and used the ability to use the observations till the current day to build the model and have the modeler predicting the missing values of energy production for the next 24 hours whilst using the 24 hours weather forecast data. |
 |
| The graph below depicts the data used as input for the modeler. The top graph is the energy production, where the last 24 hours are zero as this is the next day. The middle graph is the weather temperature, with last 24 hours using weather forecast data. The bottom graph is the uv_index, with here also for the last 24 hours using weather forecast data. |
 |
| The forecast |
| The current output of the modeler is depicted in the graph below. The top graph is the energy production (input) and the bottom graph the actual output of the model, including a the forecast for the next 24 hours at the right hand side of the graph. The energy production forecast is low, which is confirmed by the actual weather being cloudy. |
 |
| Next step |
| In a next step I further collect daily the data, thereafter I can train the model and hope to improve the predictions. |
- bogaert's blog
- Log in to post comments
